You can’t attend to everything, so you need to know when something needs your attention. With your limited resources, you’ll need to stay ahead of any problems that come up. There are several types of monitoring, and you should make sure to use them all so you have all of your bases covered. We’re going to look at how the different types of monitoring can work together to ensure your application is not only available but secure, fast, and effective. Think of monitoring as a pyramid with availability monitoring at its foundation, followed by troubleshooting tools, and capped with business metrics. (Figure 1)
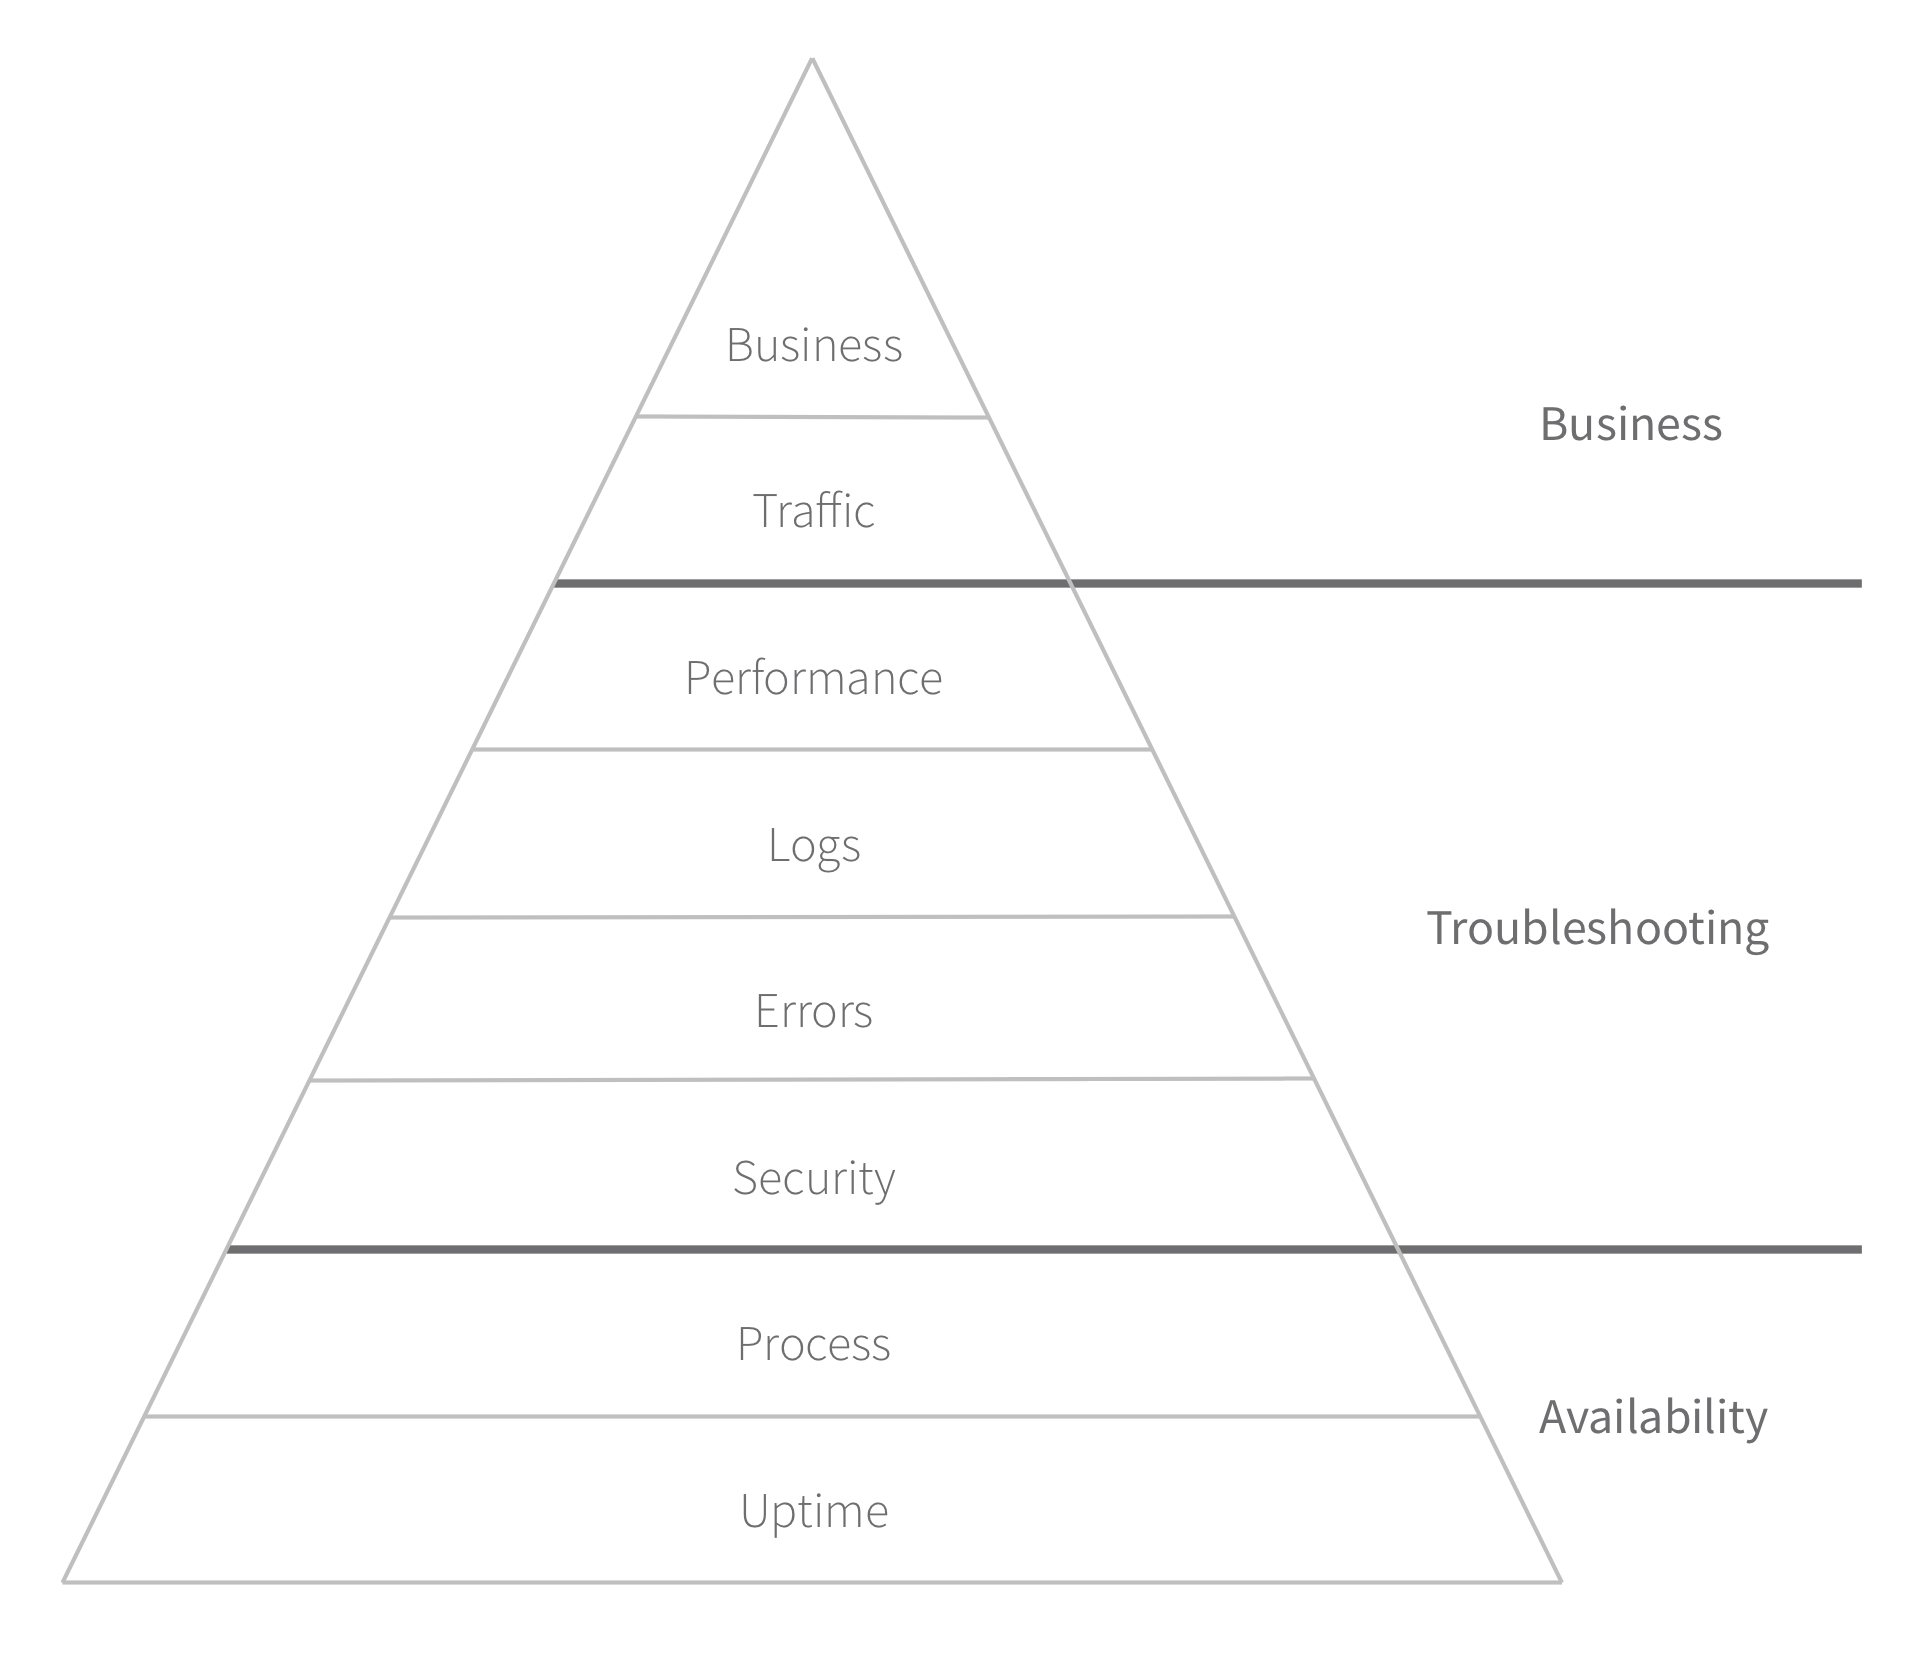
The hierarchy of monitoring and analytics tools.
↩︎Uptime and Downtime Monitoring
The most basic type of monitoring establishes your site is available. If your site goes offline, you need to know as soon as possible. On the surface, monitoring downtime may seem like a simple affair; unfortunately, the internet is a complicated beast, and high-quality downtime monitoring can be equally complicated. The simplest type of downtime monitoring is a third-party service that regularly requests a specific URL from your site. But that won’t always provide an accurate picture of your application’s availability, because you may also need to monitor your application servers and other key components.
Sifter uses Pingdom to keep an eye on several pieces of its infrastructure from multiple locations around the world. Just because Sifter is online for visitors in the United States, there are no guarantees that it’s available from elsewhere in the world. Pingdom also lets Sifter provide a publicly viewable history of uptime so customers can see for themselves how reliable Sifter is. Sifter’s performance monitoring with New Relic also provides an additional layer of downtime monitoring. Even if something were to happen to either New Relic or Pingdom, the other tool would still send the relevant alerts.
Process Monitoring
Just because your site is responding to requests from availability monitoring tools, that doesn’t mean that everything is working properly. If your application relies on background processes, you also need to make sure these processes can’t die off without a peep. To keep an eye on them, set up a tool on your servers to monitor all the relevant processes. In most cases, these tools can automatically restart a process that has died.
Sifter’s search process and background processing both run in the background, so we did our best to ensure those services wouldn’t go down if something unusual happened. We set up Monit to watch these processes; if they die, slow down or eat up too much memory, Monit will automatically send alerts and, in some cases, restart the affected processes. This is among the tools that you’ll probably get your system administrator to set up, but make sure it’s taken care of–it’s the kind of thing that’s easy to forget about until the first time one of your processes dies quietly and you’re left in the lurch.
Security Monitoring
Make sure your application is as secure as possible. If you’re handling credit cards in any way, you’ll be responsible for some level of PCI compliance. If you have a public-facing web server–which is every web application out there–run regular security scans. The frequency of the scans can vary, but daily is likely enough for most applications.
These security scan services look for common server configuration mistakes that could compromise your security, and they also look for common security holes in popular blogging and forum platforms. I cover security monitoring in much more detail in the security chapter.
Log Monitoring
Your application, server, database, and other tools will constantly generate log files. These are plain text files that effectively record everything anyone does in your application or on your server. There will come a time when you’ll need to search through these logs to troubleshoot problems. If you were to have only one server, you could search through them with Unix utilities like tail, cat, and grep, but you may as well use a service that stores and monitors your logs for you. They make it easier to search your logs, and they also let you set up automatic alerts for specific problems. These logs can quickly grow in size, so archive and rotate them regularly to prevent the system slowing down. Your system administrator should handle this for you, but it’s worth staying on top of.
I wasn’t prepared for log monitoring. Back when we started, I’d just SSH into the server and manually search the logs whenever I needed to. But that quickly became prohibitive once we added more servers. We eventually started using a dedicated service to archive and search Sifter’s logs, and it made a world of difference. It’s not cheap, but it’s much more convenient and powerful, and saves hours of digging through logs manually every month.
Error and Exception Monitoring
Once you have the basics covered, you should feel confident that you’ll know whenever your application–or a significant component–goes offline. You’ll also have the know-how to dig into the logs and do some research when something does go wrong. But what do you do if your application has a small error that only affects a few customers from time to time?
Use exception or error monitoring to catch those. Some errors may affect only a small portion of your customers, but if they’re consistently affecting those customers, you need to know. Exception monitoring is particularly helpful for tracking down the types of edge cases you might only see in production when you’re working with real data and real customers. No matter how great your code is, your application will invariably encounter situations you didn’t plan for.
There are many applications that can handle exceptions and provide alerts, but there’s no question that pushing your exception handling to a service that specializes in it is the best method. These tools help aggregate errors, find patterns, and capture and expose relevant details about the context of the error.
Performance Monitoring
Your app is up and running, and you’re staying ahead of your errors and exceptions–but is it fast? Did your latest release slow anything down? Are your customers happy with response times? That’s right–your app needs performance monitoring.
Your application might slow down at some point. Or you might have other issues that might not take your application offline but still impact your customers’ experiences. For instance, neighboring virtual servers on the host hardware can become a little selfish with resources now and then; when that happens, the performance of your virtual servers can suffer.
Performance monitoring lets you know if the service is degraded but not entirely down, and it helps you troubleshoot and proactively counteract performance issues. Sifter uses Skylight to monitor application performance. It’s an invaluable tool that helps you stay in front of potential problems by exposing performance issues before they become huge problems. That way you can take care of things on your schedule rather than abruptly address performance issues when they’ve already started to affect customers.
There are two layers to performance monitoring: front-end and back-end. It’s a well-known fact that front-end performance can have a significant impact on business. So, in addition to monitoring back-end performance, you’ll also need to employ tools to monitor front-end performance. That way, if you push a new release with some code that starts slowing things down on the front-end, you’ll be alerted to that as well.
Traffic Monitoring
You know that your application is up and running, but do you know if anyone is actually using it? What if your traffic dramatically falls overnight? Do you know which browsers your customers are using? All of these things affect your ability to deliver a great product.
I imagine that most professionals who’ve ever built a website have set up analytics of some kind. Tools for analytics can help monitor traffic, help you understand technology baselines, and offer other insights into how people use your application. But they’re really easy to overlook, what with everything else you have on your plate. I’ve read plenty of stories about people who launched their site and only then realized they had forgotten to install their analytics code. Analytics may seem like little more than vanity metrics on the surface, but once your business is up and running, the information becomes exponentially more useful.
Sifter uses Google Analytics to evaluate the marketing site’s incoming traffic. When we ran ad campaigns, it helped us understand which sites and campaigns sent the highest-quality traffic based on the average length of someone’s visit, the number of page views, the number of new visitors, and the conversion rate. The key to success with these metrics is to look for changes over time. Unless you have thousands of visitors a day, it’s dangerous to read too much into numbers collected from a single day.
Business Analytics
When you’re confident with all the other tools, you can move on to learning as much as possible about how people use your application, and you can start keeping an eye on business and activity metrics. Imagine for a moment that your site’s conversion rate were to drop from 5% to 1% soon after a new release. That’s probably almost as significant to you as your site being offline. It might not prevent your customers from buying your product, but you’ll need a solution as quickly as possible.
Some analytics tools can be extended to provide a level of business insight, but if you want in-depth business metrics, you’re probably best off with a dedicated business analytics tool. Depending on your application, there’s a good chance there are several usage and activity metrics that can help assure you that everything’s running smoothly and your customers are happy. It’s just as important to be alerted of changes in these numbers as it is if your application were to go offline.
The Power of Knowledge
Once your site is live, it’s easy to focus on things like customer feedback and feature requests, but your application’s performance can be just as relevant. These tools help you stay ahead of problems–or at least keep you in the loop as problems occur. When you have a small team, it’s much more difficult to put out fires than to spend a little bit of time each day making sure everything is running smoothly. If you make the effort of setting up these tools, your site will run more efficiently, and you’ll be able to approach any issues proactively rather than reactively.
You’re going to be juggling a lot of tasks. The more monitoring and alerting you can automate and push off on to machines, the better. That way you can stay focused on improving the business rather than monitoring its pulse.